Welcome to the Second Edition of "Data Stories" Research Visualization Exhibition at CEU!
Last year's event, the first in a series of many to come, was a great success. The exhibition displayed 19 research visualizations of both qualitative and quantitative information, and gathered together 13 young and senior scholars from 7 different departments at CEU who contributed to the event. We hope this second edition will be even more fruitful and engaging!
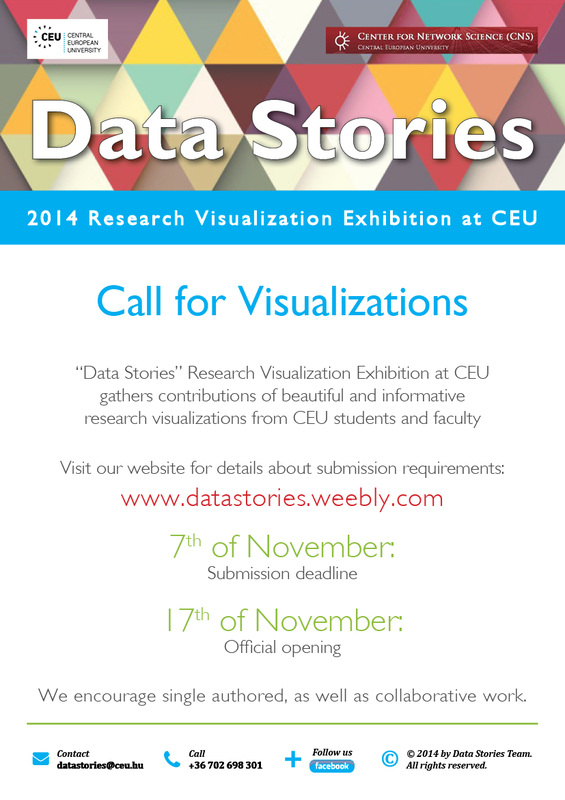
This year, the Call for Visualizations starts on September 15 and ends on November 7.
The Official Opening of the Exhibition will be on November 17, and the visualizations will be displayed until November 29.
Look for our posters around the campus, and stay tuned on social media for more updates about this year's event. Follow us on Facebook and Twitter, and feel free to drop us an e-mail if you have questions about how to participate.
We are looking forward to receiving your contributions!
Last year's event, the first in a series of many to come, was a great success. The exhibition displayed 19 research visualizations of both qualitative and quantitative information, and gathered together 13 young and senior scholars from 7 different departments at CEU who contributed to the event. We hope this second edition will be even more fruitful and engaging!
This year, the Call for Visualizations starts on September 15 and ends on November 7.
The Official Opening of the Exhibition will be on November 17, and the visualizations will be displayed until November 29.
Look for our posters around the campus, and stay tuned on social media for more updates about this year's event. Follow us on Facebook and Twitter, and feel free to drop us an e-mail if you have questions about how to participate.
We are looking forward to receiving your contributions!